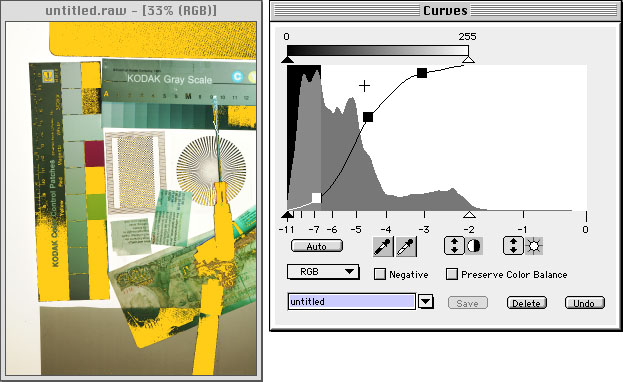
The curves window controls how your scans are converted from 48-bit to 24-bit and the most important tool in the software. We recommend that you make all corrections here, rather than in an 24-bit image manipulation software because you have a great deal more information in 48-bit than after the image has been saved as a 24-bit TIFF.
To set up the conversion from 48- to 24-bit just follow these three easy steps:
- Choose the 48-bit data that you want to convert to 24-bit by using the Level Sliders based on the information in the Histogram
- Choose the 24-bit range that the image should be converted to by adjusting the Output Levels
- Choose how the information is converted to 24-bit by adjusting the Tone Curve
The two triangles at the bottom of the Histogram are the Level Sliders.
Use the Level Sliders to choose the 48-bit data that you want to convert to 24-bit. How do you make this decision, Easy, just pick one of the following ways
There are three ways to select the values to be converted to 24-bit:
1. Automatic
click the "Auto” button
2. Pixel Selection
select an eye dropper an click in the image
3. Graphical Adjustment
move the triangles at the bottom to the point you desire.
The option "preserve color balance” prevents the software from automatically adjusting the individual color channels and removing any color cast.
back to the Step by StepThe triangles above the histogram are the Output Levels. These set the minimum 24-bit black value and the maximum 24-bit white value
For example, if you have been advised by your printer to limit the highlights to 250 and limit the shadows to 20, you would simply move the shadow output level to 20 and the highlight output level to 250.
All of the effects of these movements will be immediately visible on your Prescan.
The tone curve is a graphical representation of the mapping between the capture values as defined by the Level Sliders and the export values. As you move the control points on the tone curve, the shape of the curve changes and you see the effects on the prescan immediately.
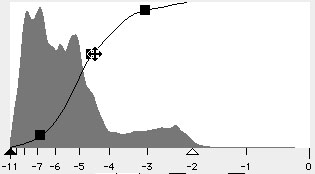
You can improve sensitivity as well as definition in the midtone areas by creating an S-Curve as in the screen shot above.
Tone Range Highlighting
The Tone range highlighting provides a quick and easy way to locate and control specific values in your image